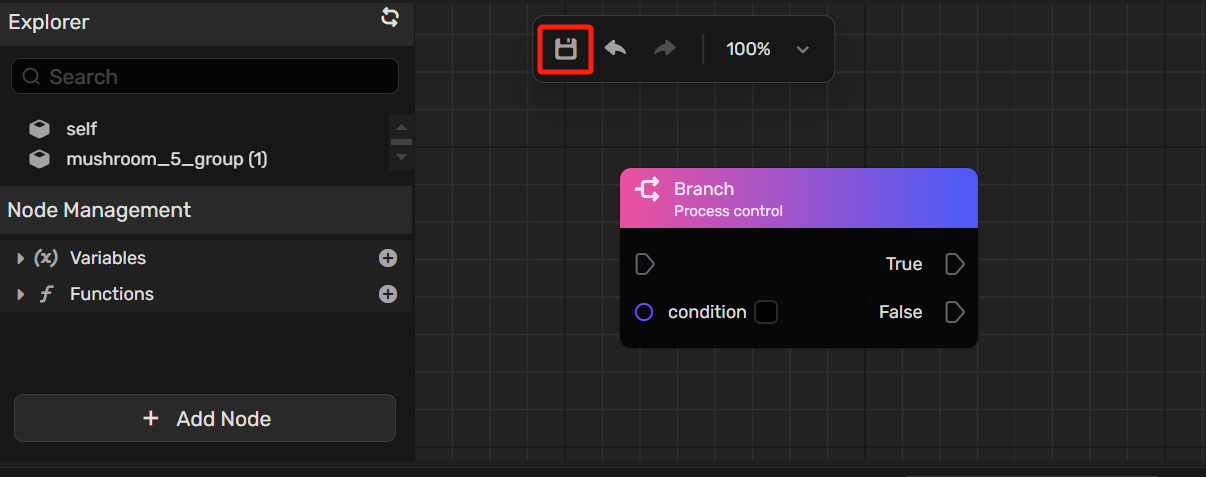
Node graph
Node graphs provide game developers with an intuitive, visual scripting system that follows a node-based workflow. Every node in the system is generated directly through a Yahaha API, allowing developers to create gameplay features that are as remarkable and distinctive as those created in Lua scripting but in a more visual way.
Prerequisite
Visual Studio Code is installed and integrated with your Studio. If you haven't done this already, follow the instructions in How to start coding to download and integrate.
Adding a node graph
To add a node graph:
- Open any space in YAHAHA Desktop.
- Choose the object that you want to attach a node graph to and click the More button in the upper right corner.
-
In the Properties window, click the drop-down arrow on the + Feature button.
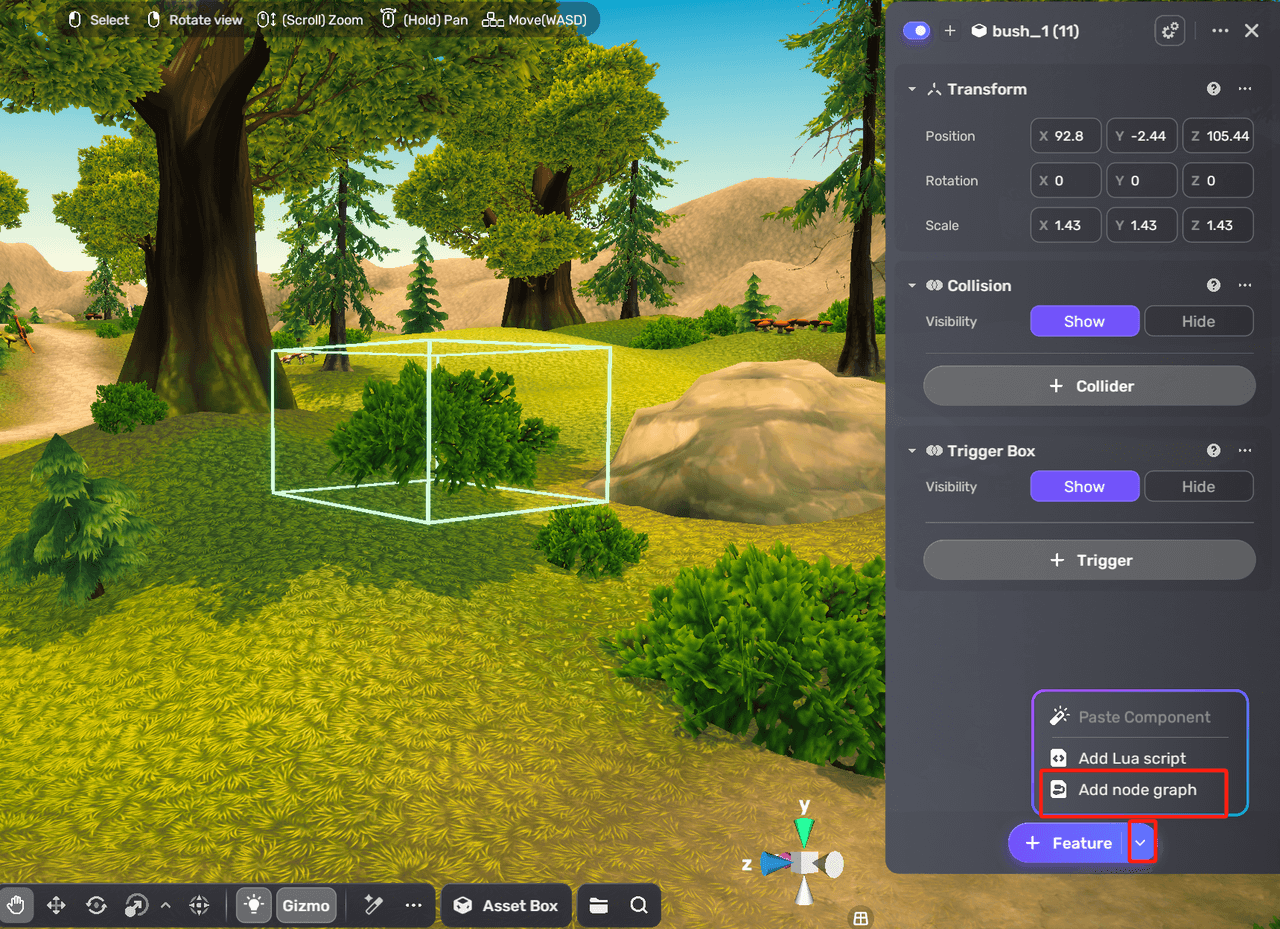
-
You can either choose an existing node graph that you have created for other objects or choose + New node graph to create a graph from scratch.
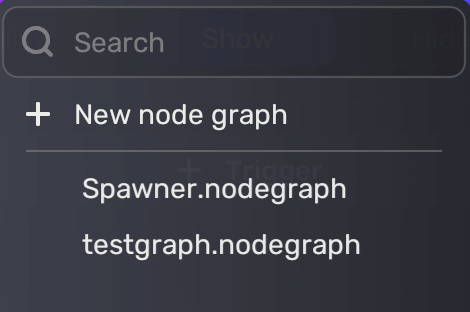
-
Click the Edit button to edit your node graph in your code editor.
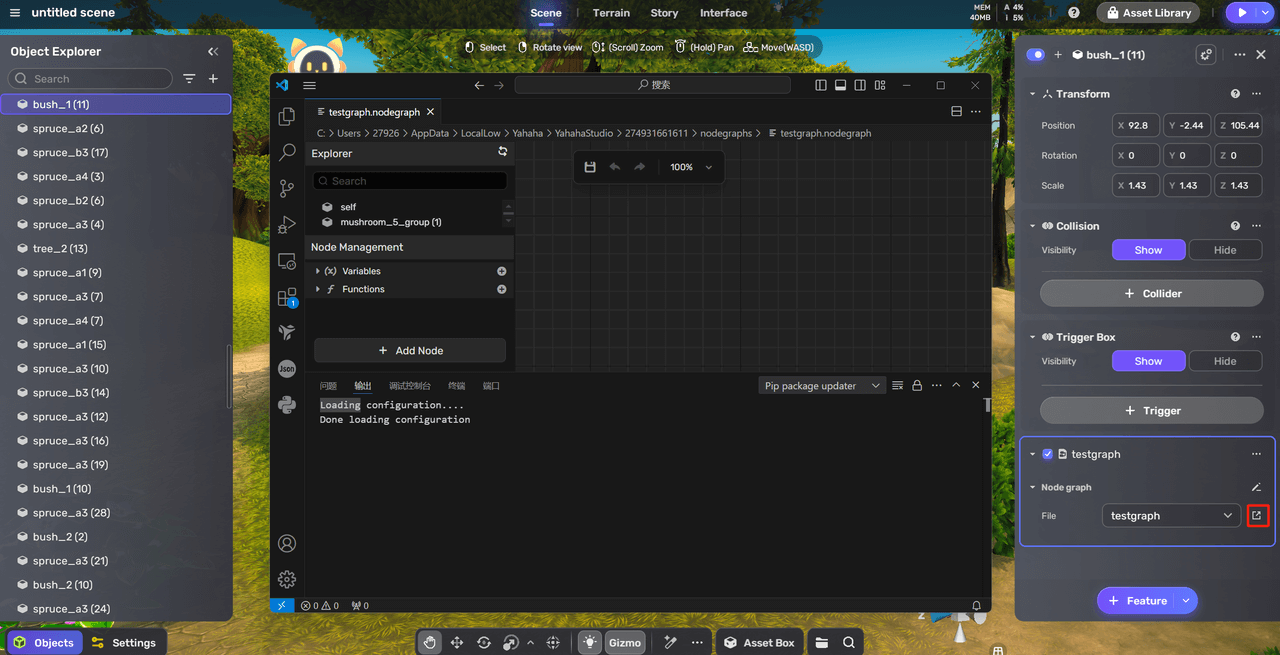
Using the node graph
The node graph is made up of nodes and edges, which together form the logic of your application. Each node is a quadrate modular block added to the node graph, featuring various ports that enable logic implementation. The ports can be connected by edges that you create.
Creating nodes
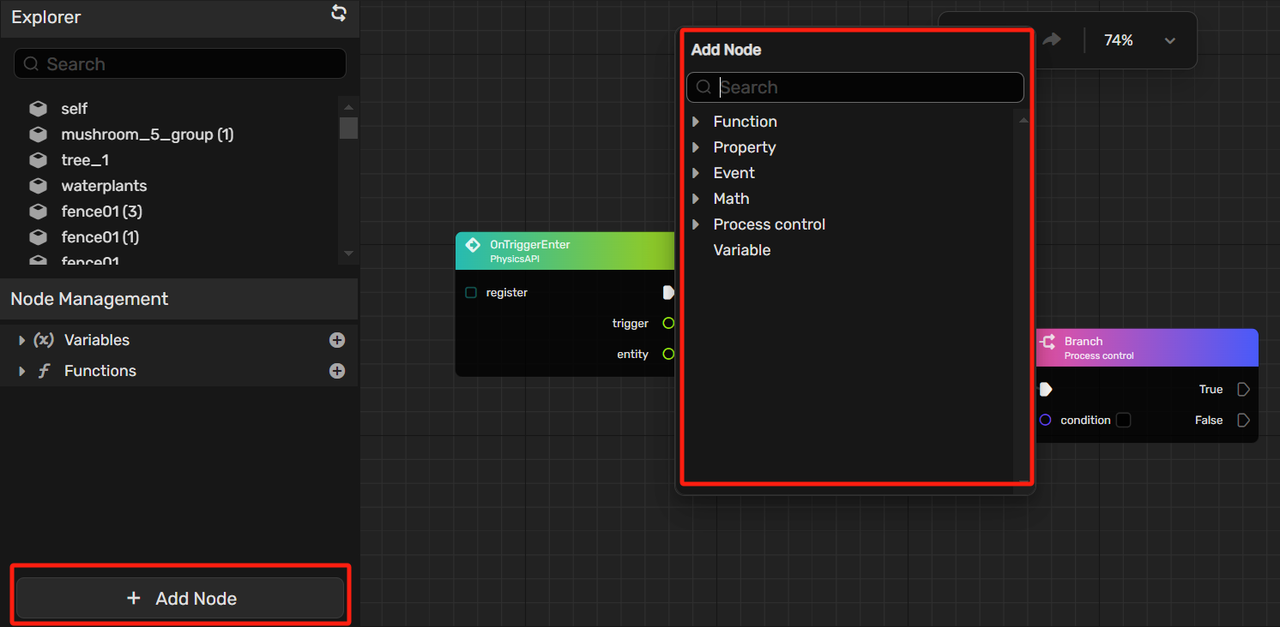
To build a complete logic chain, you'll need to create several nodes. Start by adding the nodes you require. You can do this by clicking Add Node or by right-clicking on a blank space in the editor to create a new node. Nodes will appear as blocks within the editor.
Connecting nodes
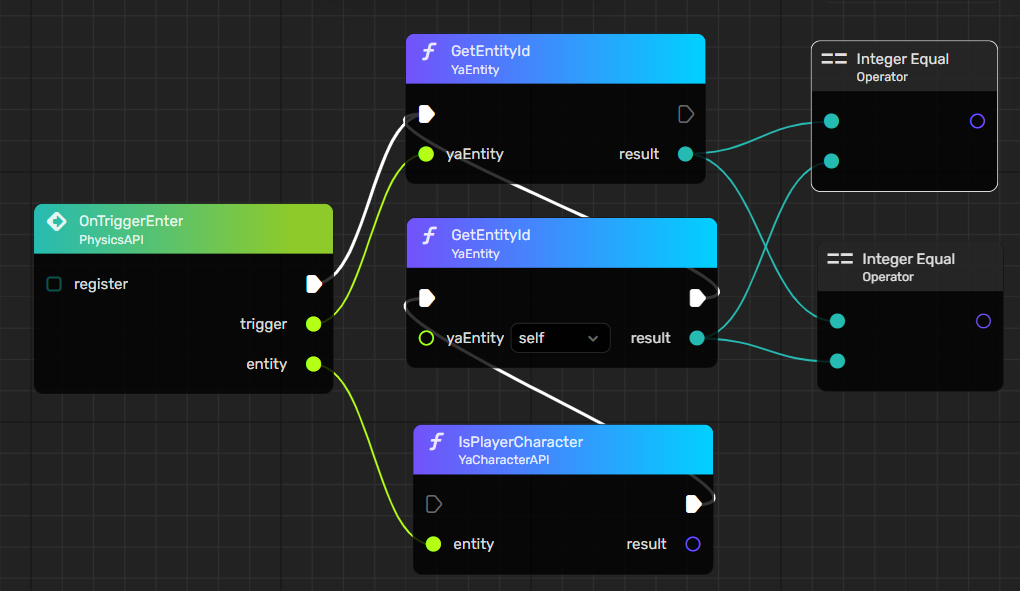
Once your nodes are in place, the next step is to connect them according to their logical relationships. Connect a port from one node to a compatible port on another node to create an edge. These edges define the logic flow in a visual scripting graph. Click any port to initiate a new edge.
Edges are color-coded based on the type of data they handle. White edges control the main logic flow, while edges of other colors manage additional data types to ensure the process functions correctly. Keep the following points in mind when connecting your node graph:
- Port orientation: The left side of each node contains input ports, while the right side contains output ports. Connect an output port from one node to an input port on another node using an edge.
- Self-connections: You cannot connect a node's output port back to its own input port.
-
Connection limits: White (control) ports can only be connected once, whereas ports of other colors (data ports) can be connected multiple times.
Saving the node graph
Please note that the node graph does not save automatically, so remember to click the Save button to save the node graph before getting back to Studio.
