Debugging Lua scripts
YAHAHA Studio supports Visual Studio Code for debugging Lua scripts, allowing you to inspect your source code while your application runs. Follow the steps below to set up the debugger and use breakpoints effectively.
Setup
Make sure you have completed the Integrated development environment (IDE) support and then take the following steps to set up your debugger for YAHAHA Studio.
Install debugger in VS Code
- Open Visual Studio Code.
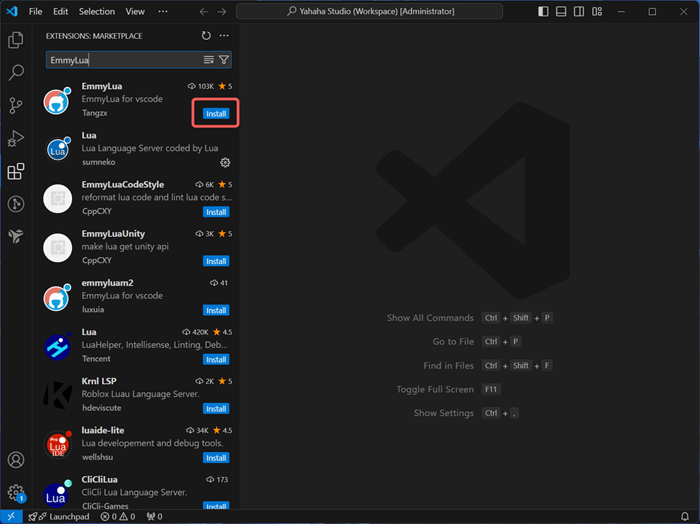
- Search for EmmyLua in the Extension Marketplace.
- Click Install to install the debugger.
Configure debugger in VS Code
-
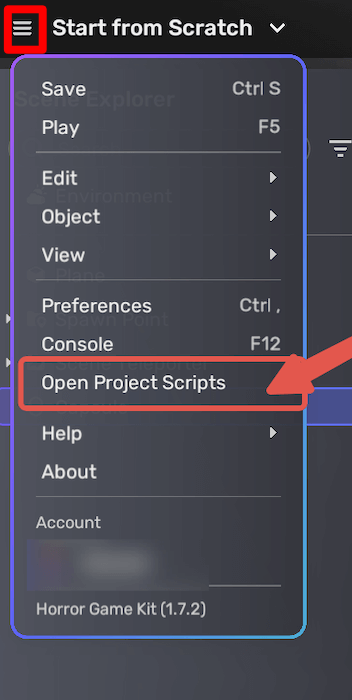
In YAHAHA Studio, click Menu > Open Project Scripts to access your horror project scripts in Visual Studio Code.
-
In a Lua project, you see a YahahaDebug.lua file under Project Scripts.
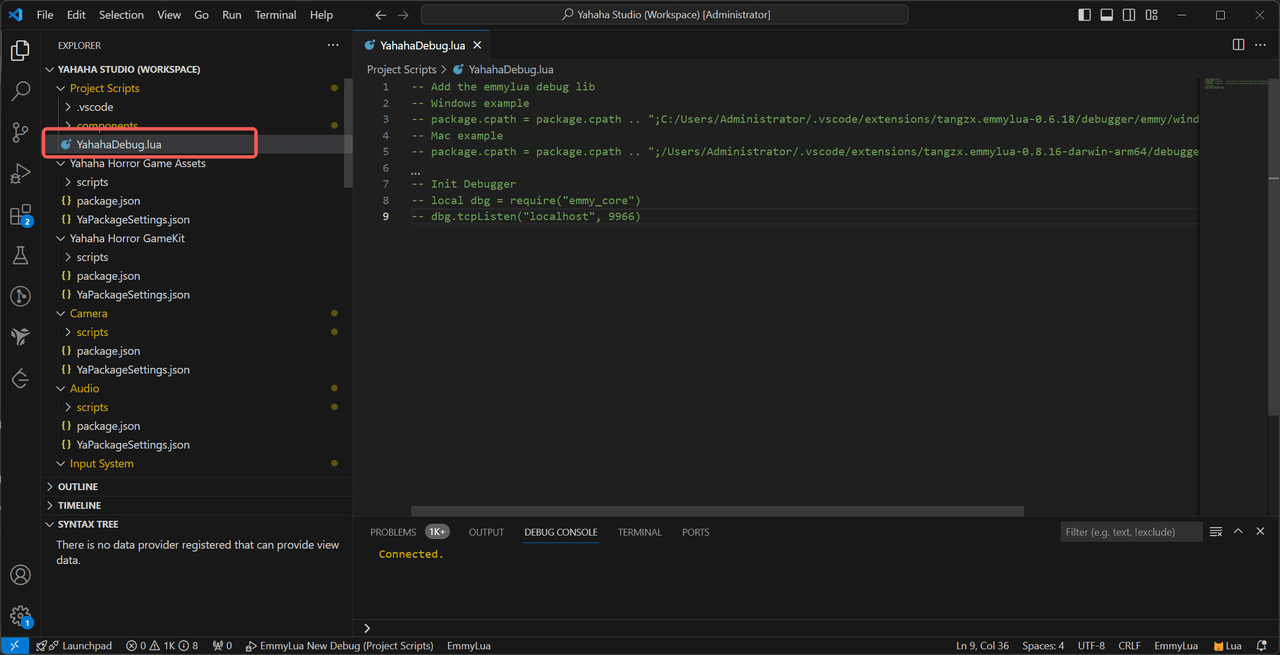
To enable the debugger:
- Include the EmmyLua extension's debugger library in your script's cpath. However, note that extension updates may impact this path. To avoid potential issues, consider disabling EmmyLua updates.
- Initialize the debugger within your Lua script.
Here are example code snippets for Windows and Mac:
Windows example:
-- The path is by default in C:/Users/{Your User Name}/.vscode/extensions/{extension id}/debugger/emmy/windows/x64/emmy_core.dll
package.cpath = package.cpath .. ";C:/Users/Administrator/.vscode/extensions/tangzx.emmylua-0.6.18/debugger/emmy/windows/x64/emmy_core.dll"

-- Init Debugger
local dbg = require("emmy_core")
dbg.tcpListen("localhost", 9966)
Mac example:
-- The path is by default in /Users/{Your User Name}/.vscode/extensions/{extension id}/debugger/emmy/mac/x64/emmy_core.dylib
package.cpath = package.cpath .. ";/Users/Administrator/.vscode/extensions/tangzx.emmylua-0.8.16-darwin-arm64/debugger/emmy/mac/x64/emmy_core.dylib"

-- Init Debugger
local dbg = require("emmy_core")
dbg.tcpListen("localhost", 9966)
Debug in YAHAHA Studio
Attach VS Code to YAHAHA Studio
After installing the EmmyLua extension in Visual Studio Code, you can attach it to YAHAHA Studio using the following steps:
-
In YAHAHA Studio, enter Play Mode to connect with the debugger.
-
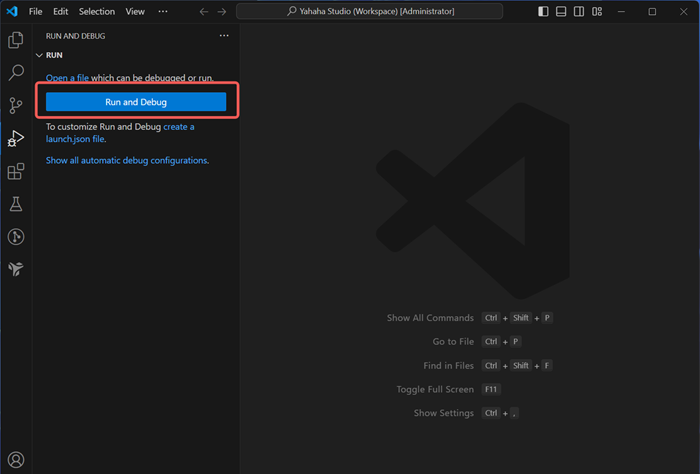
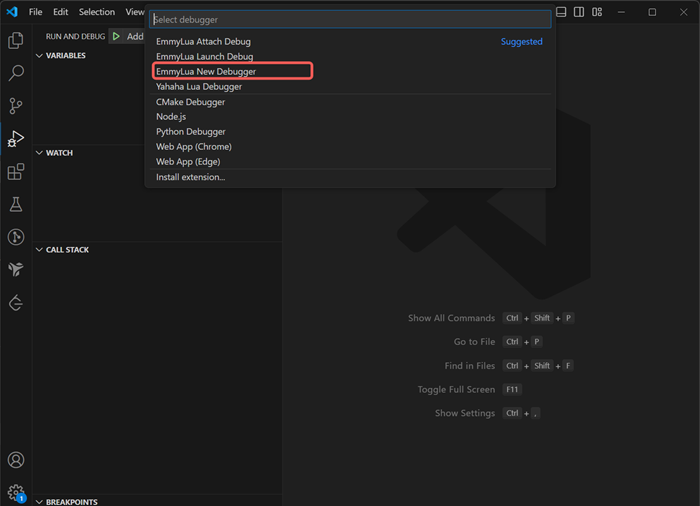
In Visual Studio Code, switch to the Run and Debug view.
-
Click the Run and Debug button.
-
In the dropdown menu at the editor's top, search for and select EmmyLua New Debugger.
Start debugging
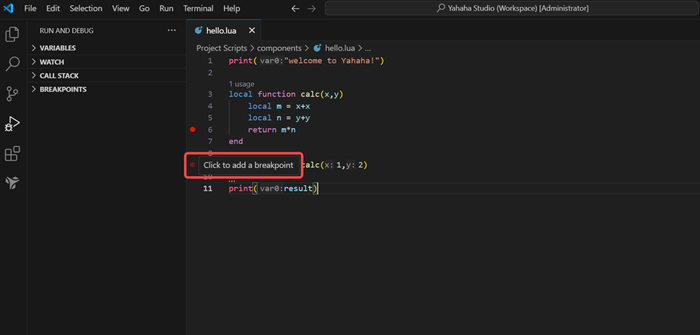
In a Lua script, you can examine the contents of variables step-by-step by setting breakpoints in your code editor. To set a breakpoint, click the gutter (the column left of your code) next to the line where you want the debugger to pause. A red circle will appear beside the line number, highlighting the line, and indicating a successful breakpoint setup.
Code example:
print("welcome to Yahaha!")

local function calc(x,y)
    local m = x+x
    local n = y+y
    return m*n
end

local result = calc(1,2)

print(result)
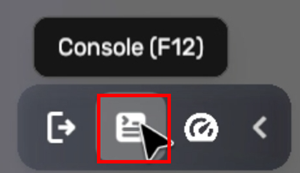
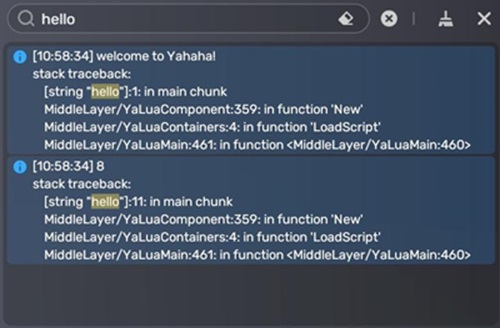
Enter Play Mode in YAHAHA Studio and you can view the results in the Console by either pressing F12 or clicking the Console button located in the bottom toolbar.
Stop debugging
To stop debugging, click the Disconnect button in Visual Studio Code.
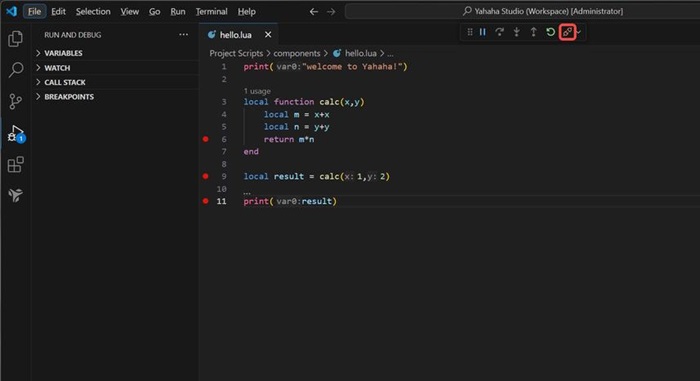
Now, you can open and edit scripts directly in Visual Studio Code from YAHAHA Studio, benefiting from features like code completion, syntax highlighting, breakpoints, and debugging tools specifically tailored for Lua development.
Troubleshoot the debugger
- In some cases, anti-virus software can significantly affect debugger performance. If you experience a noticeable slowdown and wish to continue using the debugger, it may be necessary to temporarily disable the anti-virus software. This can result in improved debugging speed, such as reducing the time taken to set breakpoints to under 10 seconds.
- For more information on the scripting language Lua, see Lua Reference Manual.